COVID-19 Dashboard
Healthcare project delivered during my work at Philips in 2020.

Goal
The initiative started with the need to provide safe and reliable information to hospitals in understanding the flow of patients tested for COVID-19, (including confirmed, suspected or negative cases) based on the diagnoses provided by clinicians. The aim was to improve communications across hospitals to manage their individual capacities through a cloud-based, online collaborative platform. This allowed participant hospitals to share and manage resources such as available beds collectively for the treatment of the overwhelming number of COVID-19 patients.
My role and responsabilities:
- Collaboration with stakeholders to map the user requirements
- Providing low and high fidelity prototypes
- Presenting the design solution to stakeholders
- Facilitating communication between teams (dev, design, biz)

The major challenge was to respond quickly to the COVID-19 crisis, and launch a feasible, viable and desirable solution within eight weeks. To achieve this aggressive timetable, the process involved qualified specialists from five teams: Design, Technology, Development, Product, and Clinical.
Main user requirements:
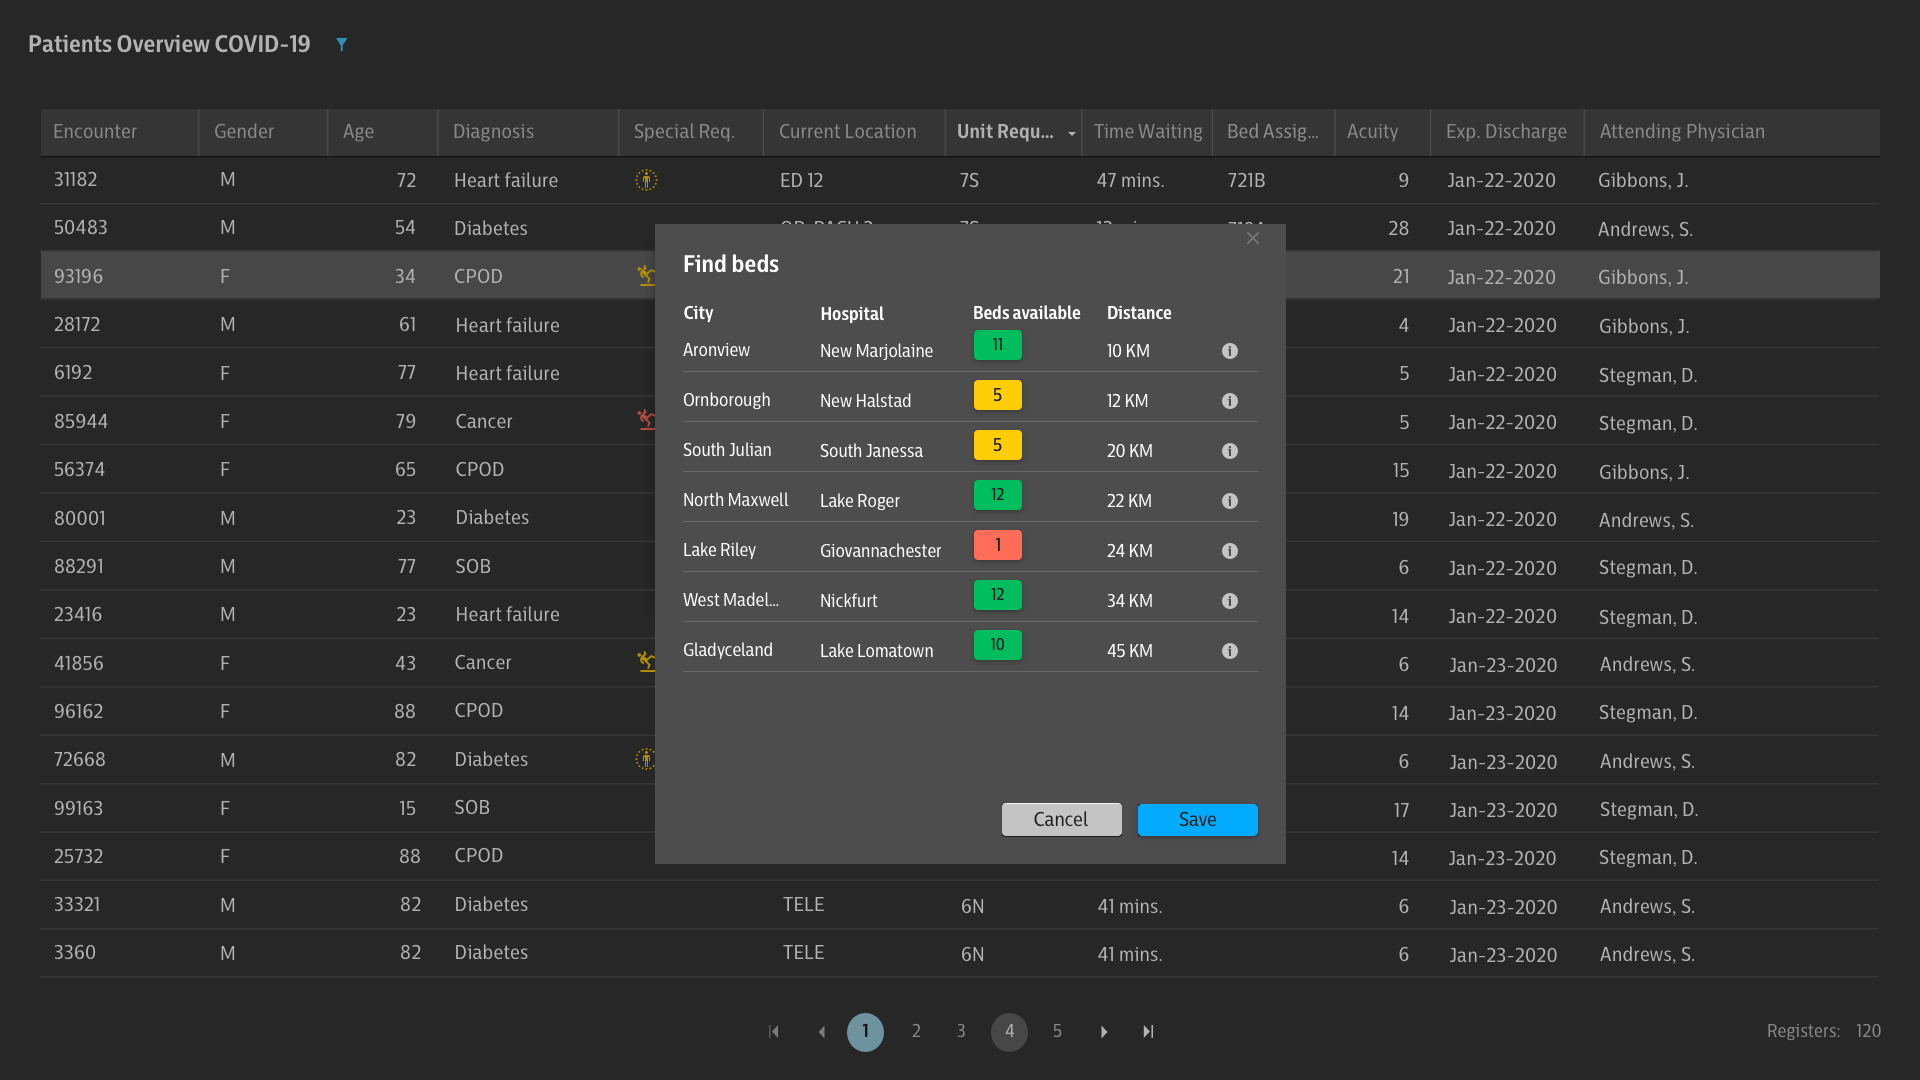
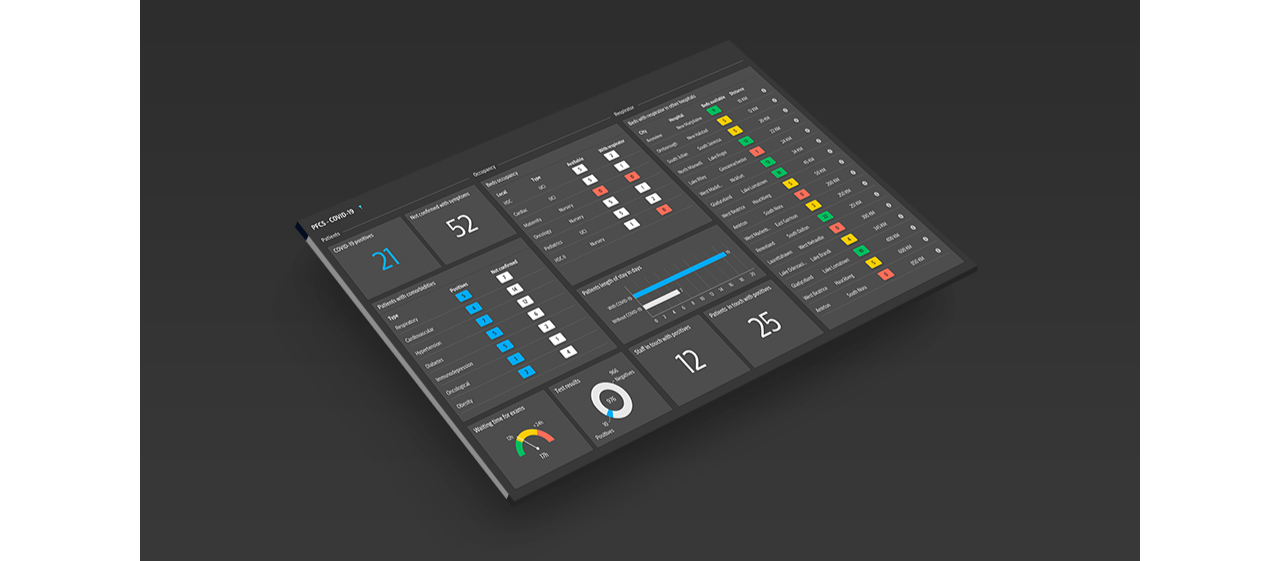
- Beds available with respirator nearby.
- Length of patients stay.
- Patients symptoms.
- Types of comorbidities.
- Nursery vs UCI occupancy.
- Staff and other patients in contact with positives cases.
- Positives vs Negatives tests results.
- Waiting time for the results.

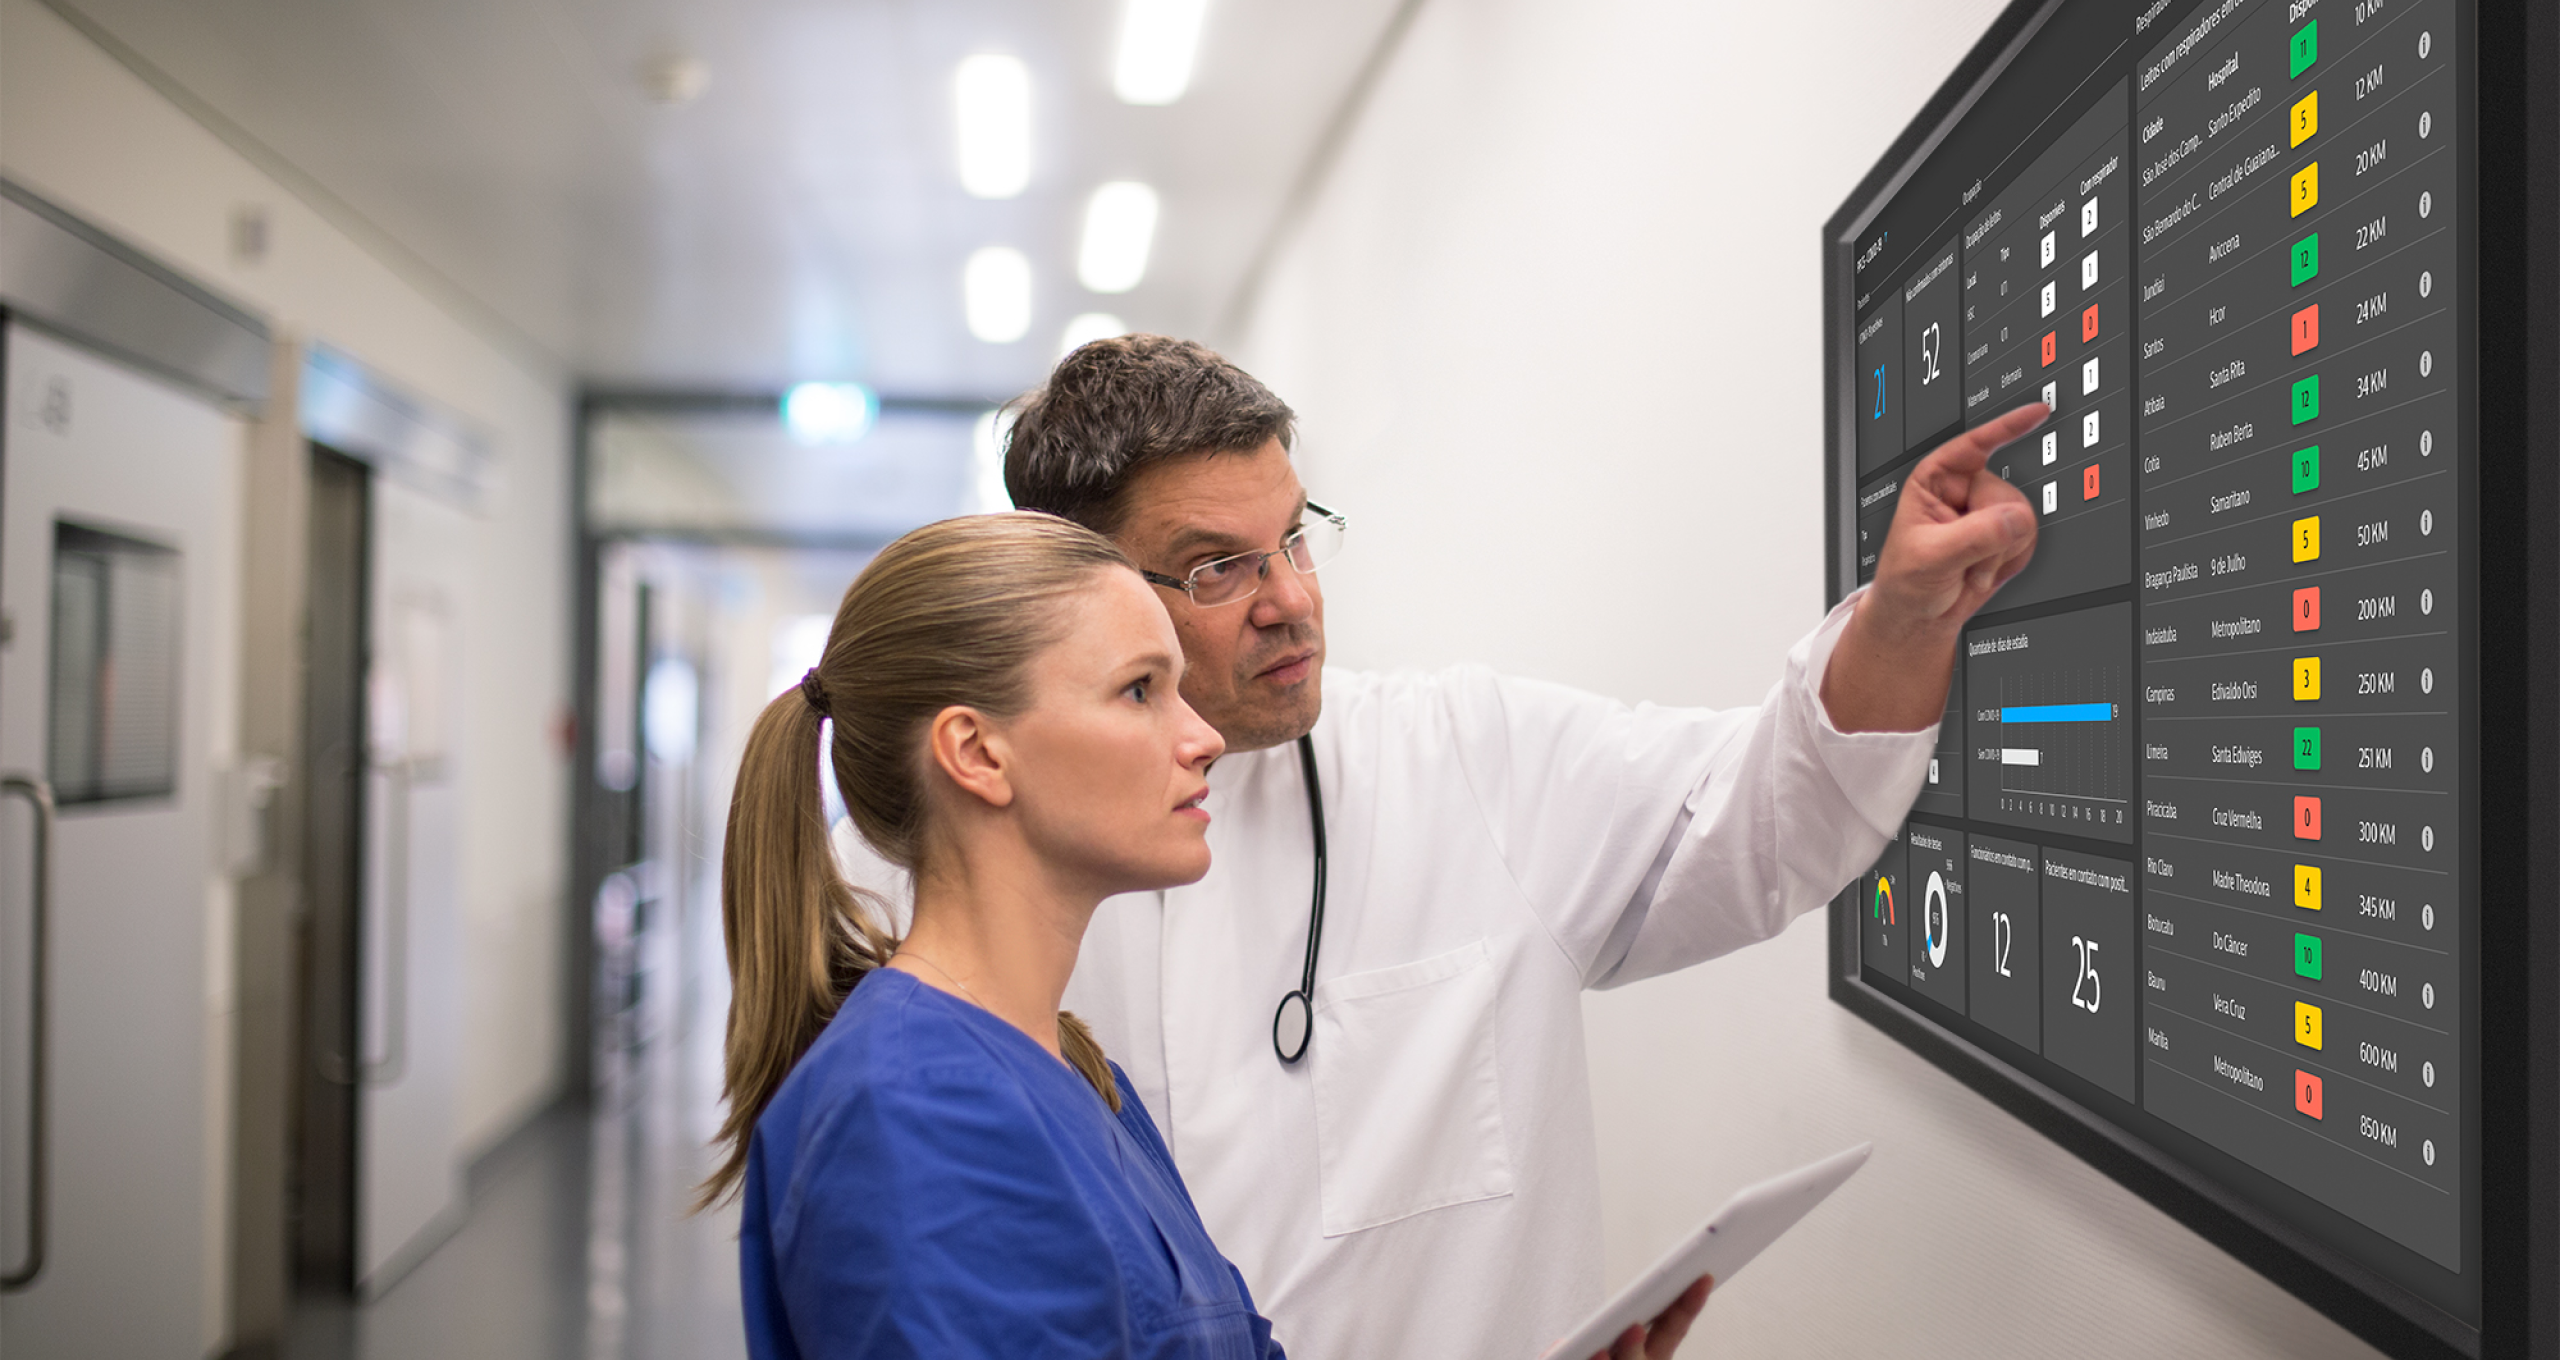
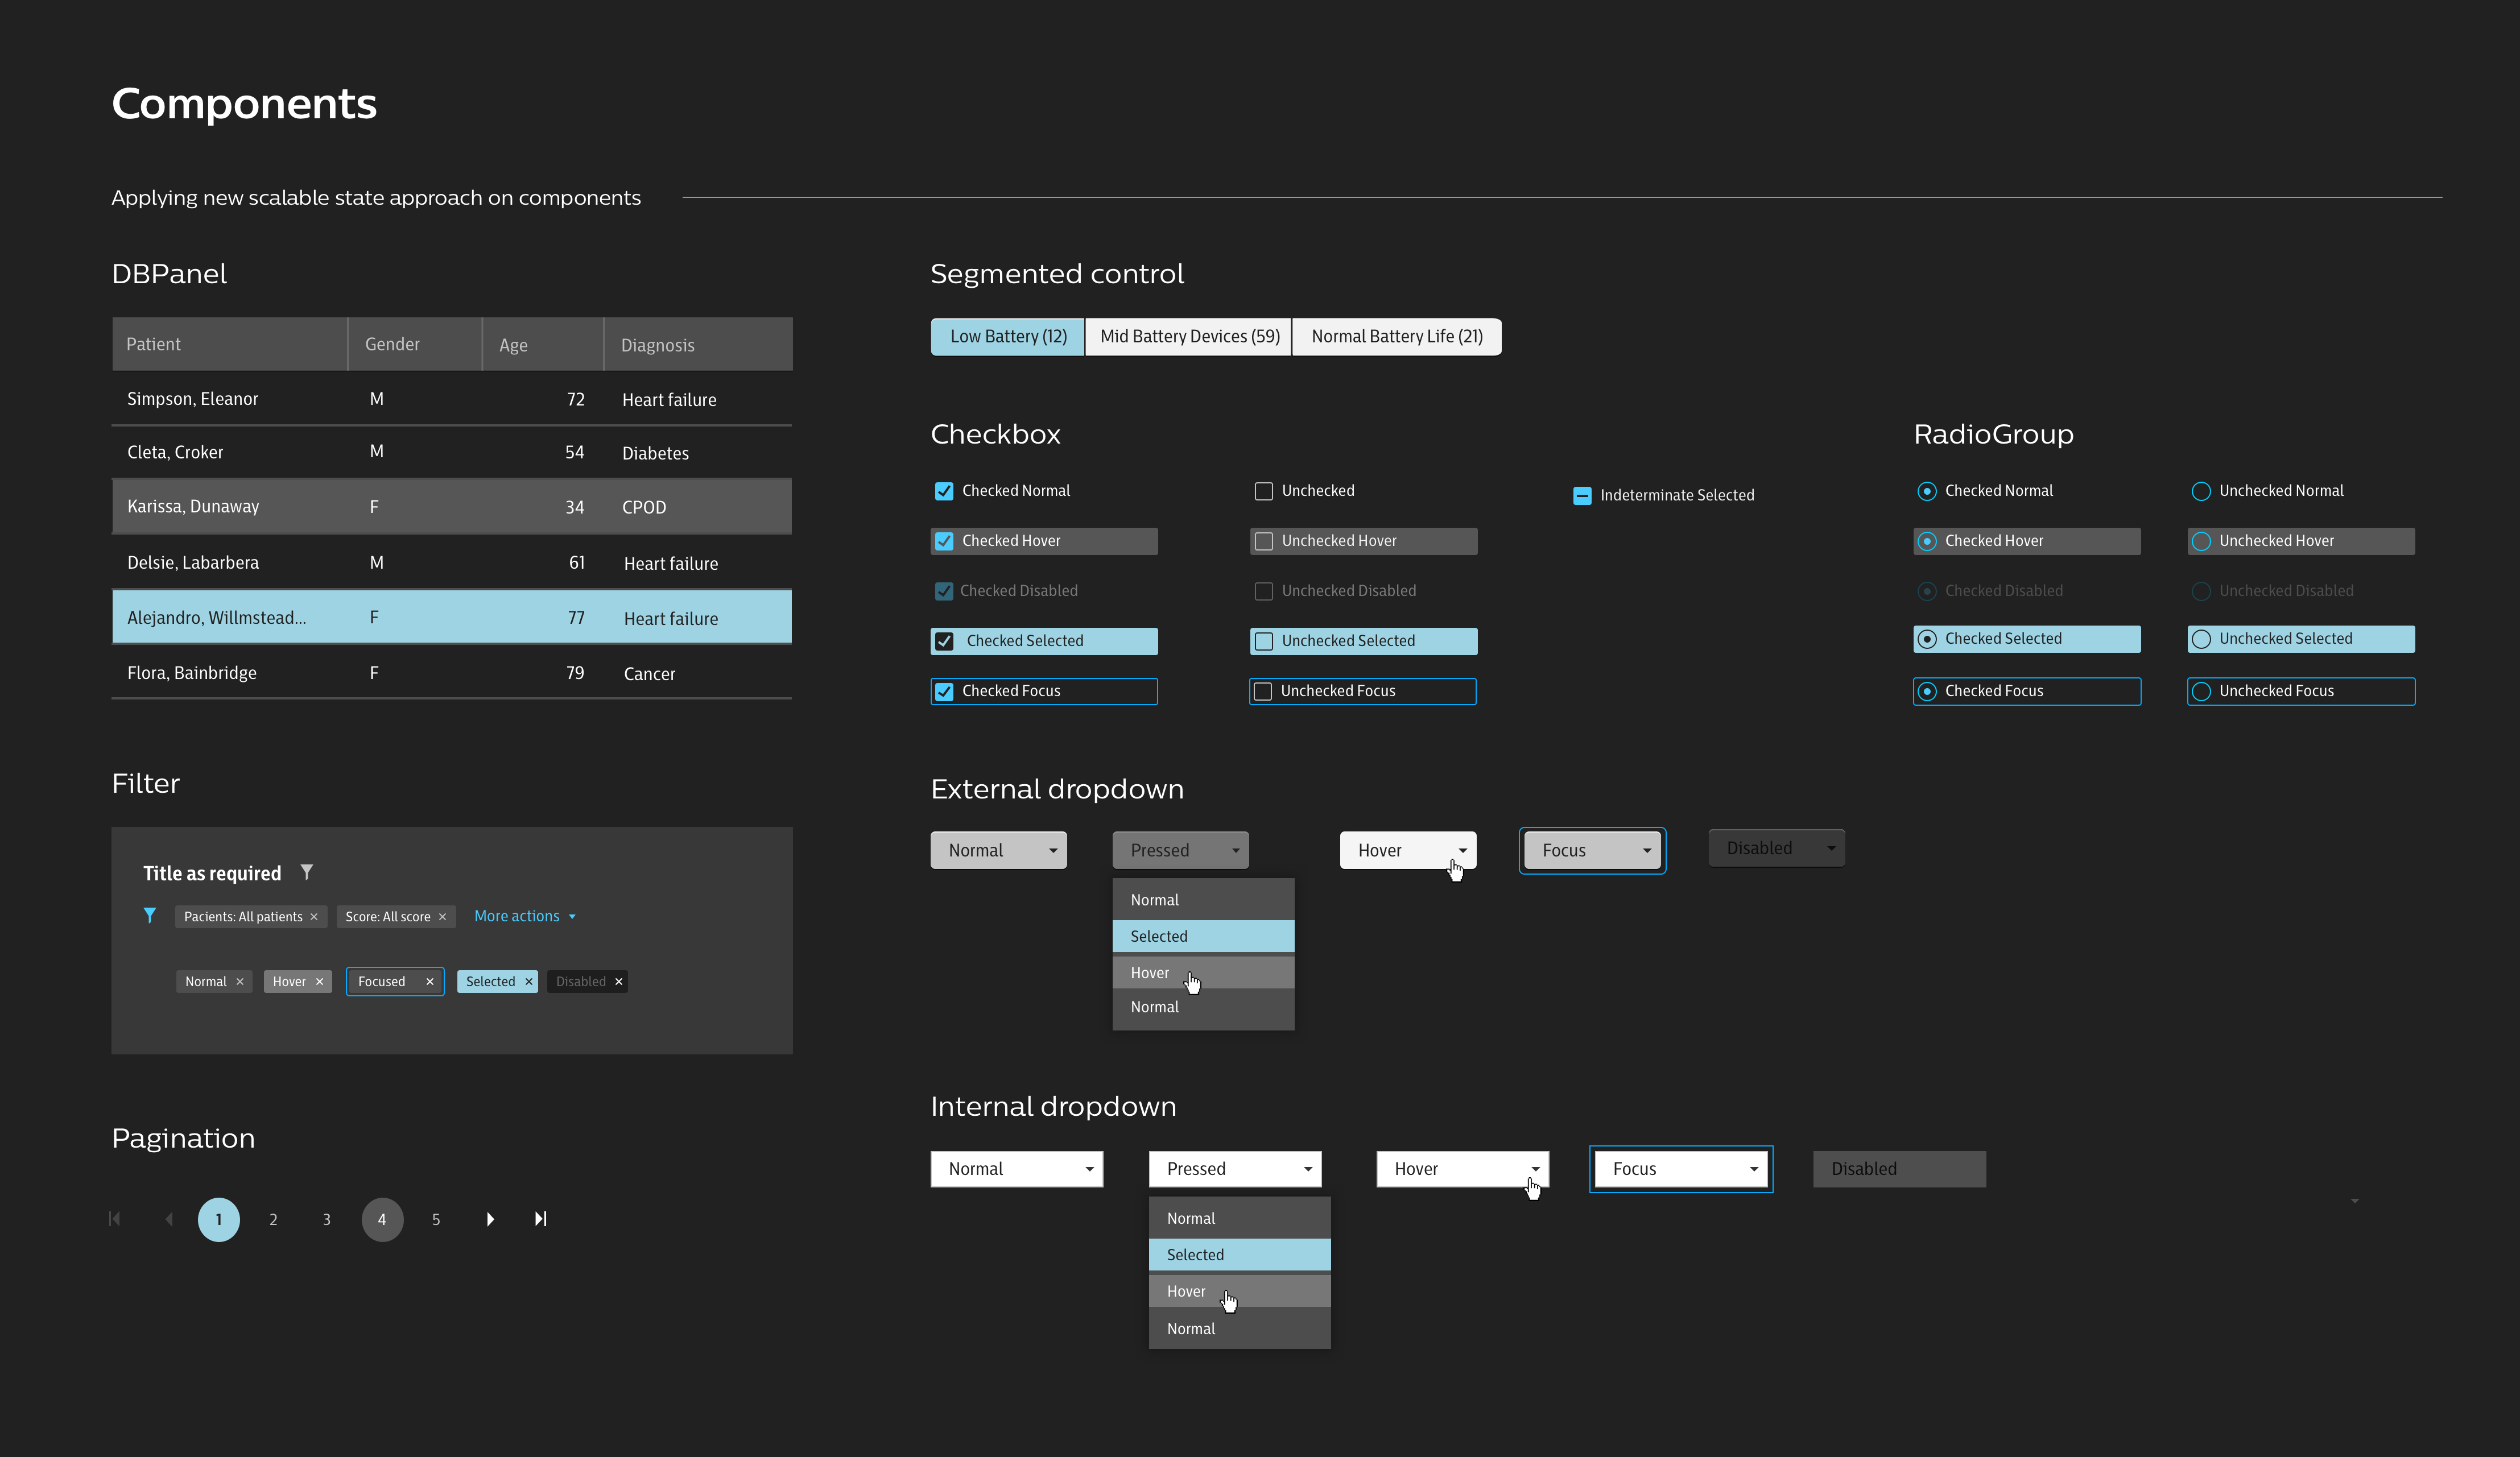
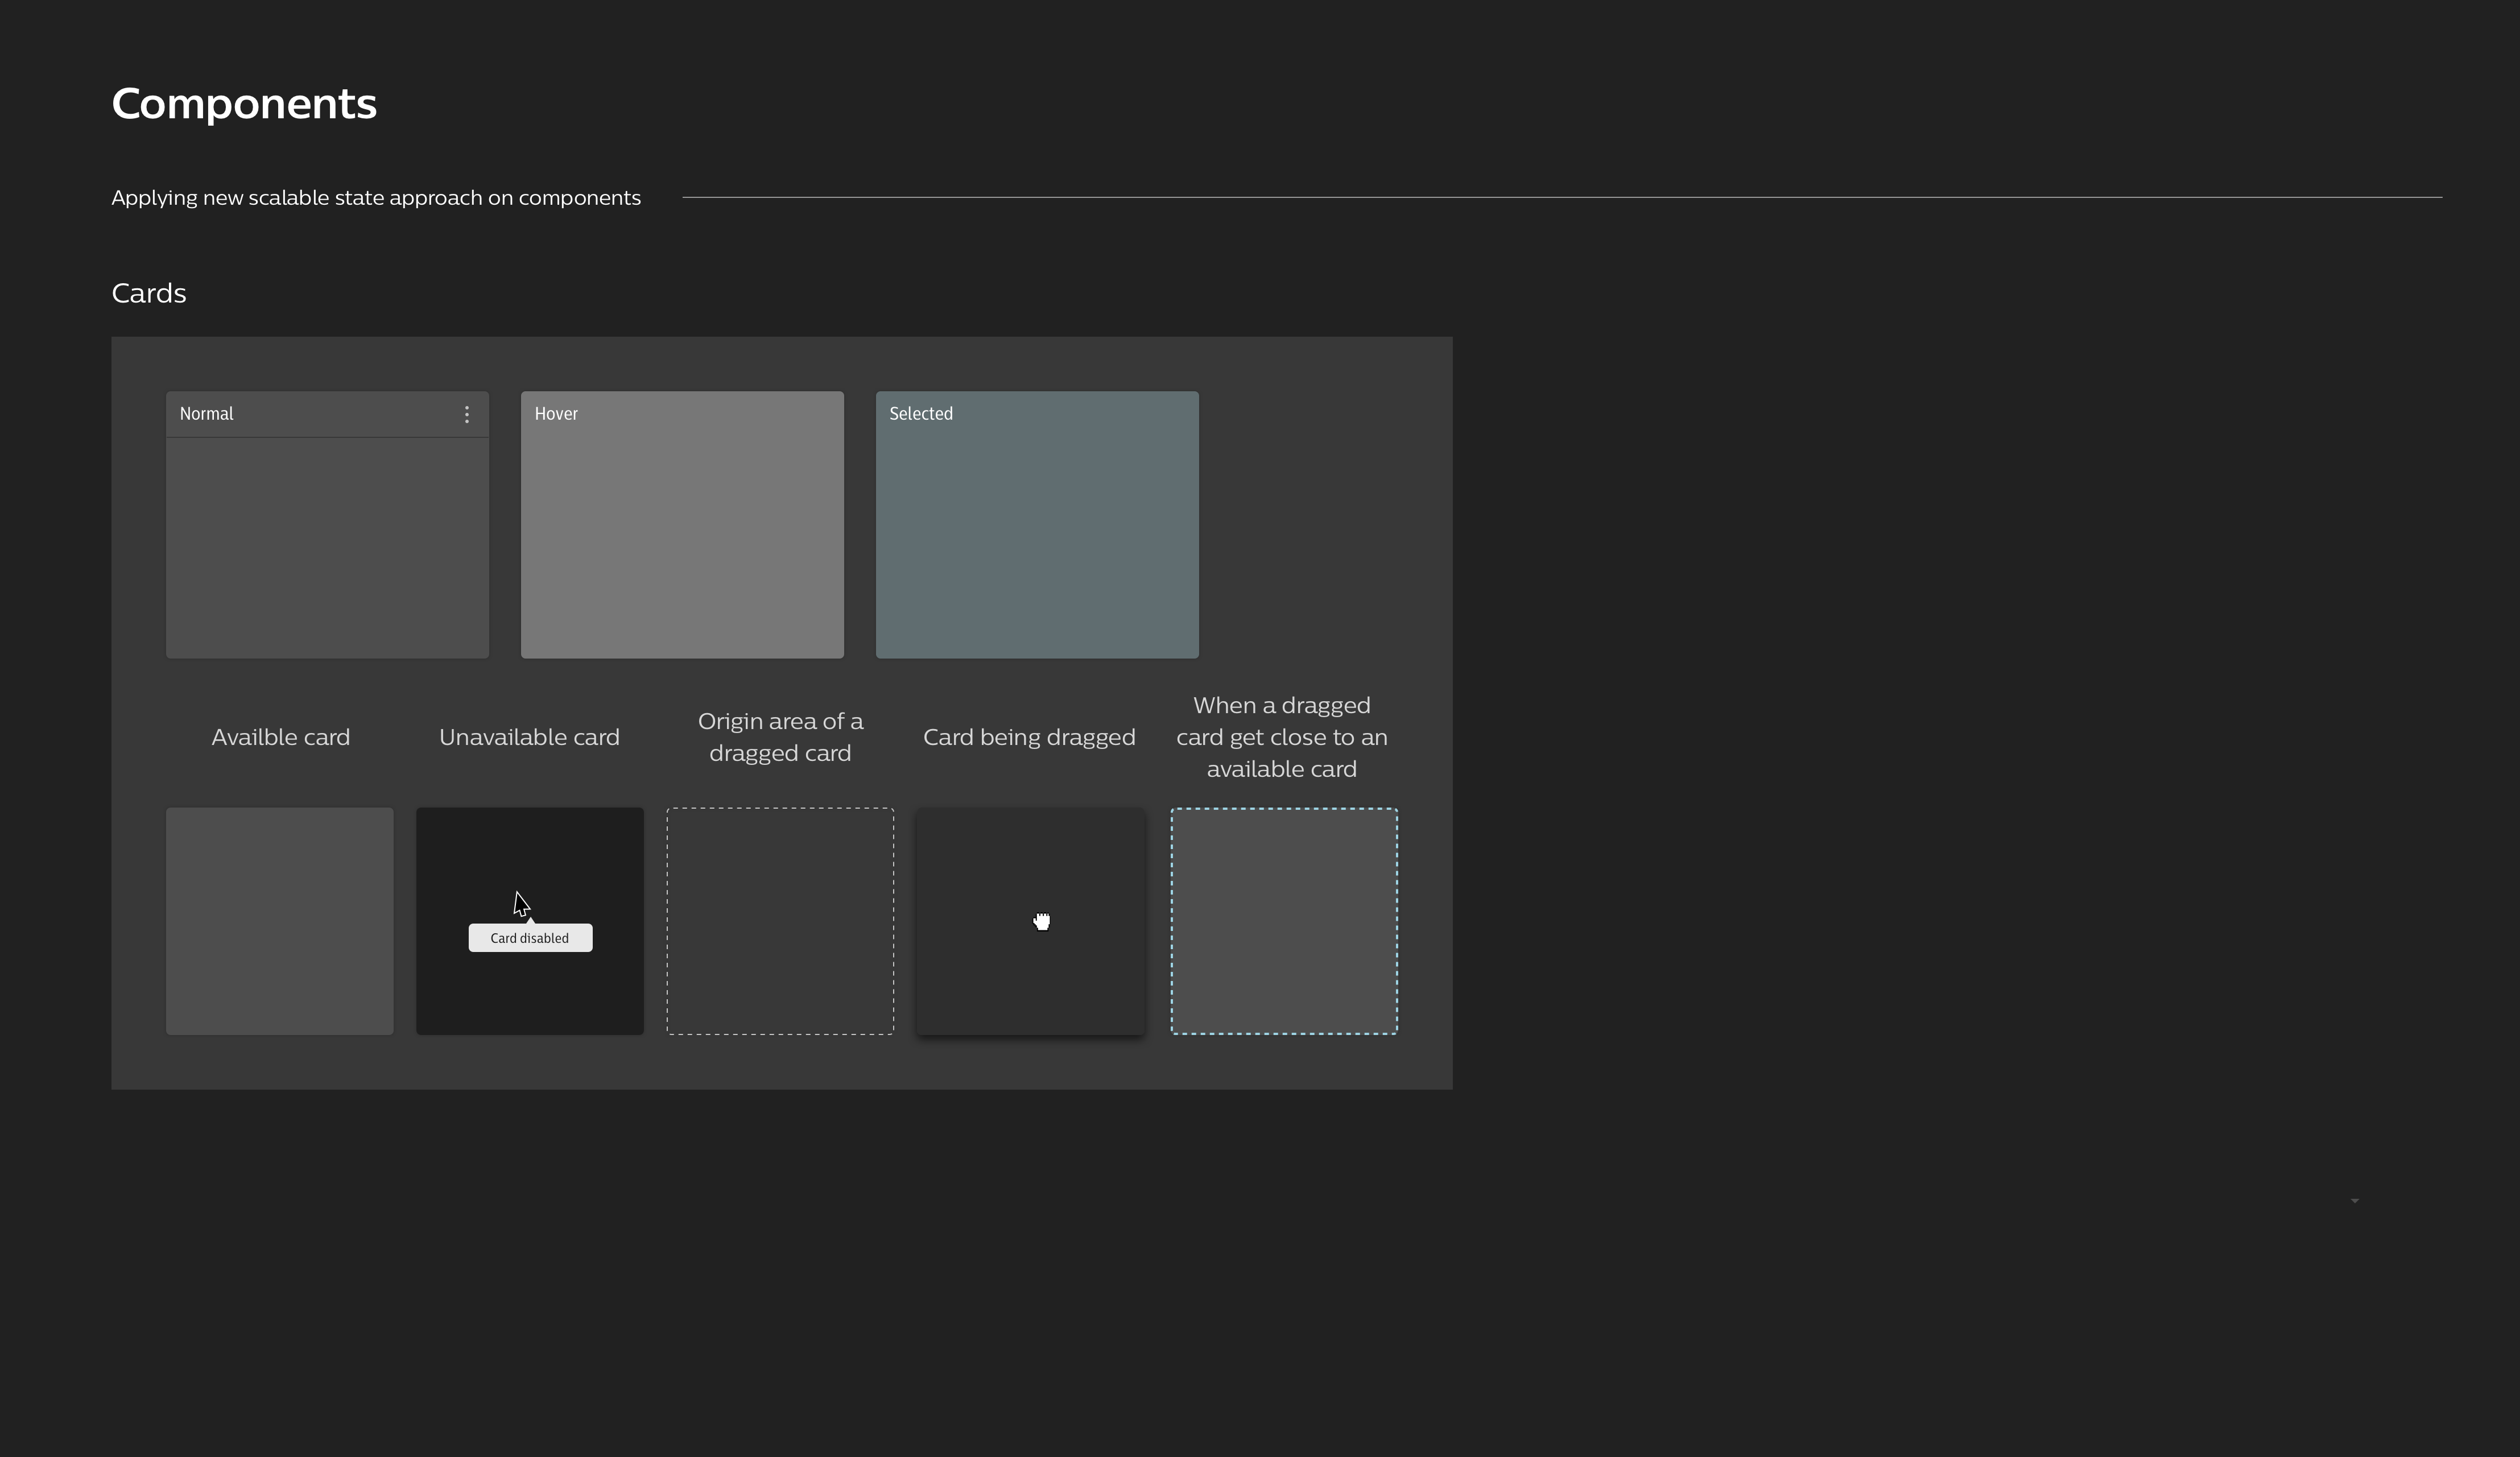
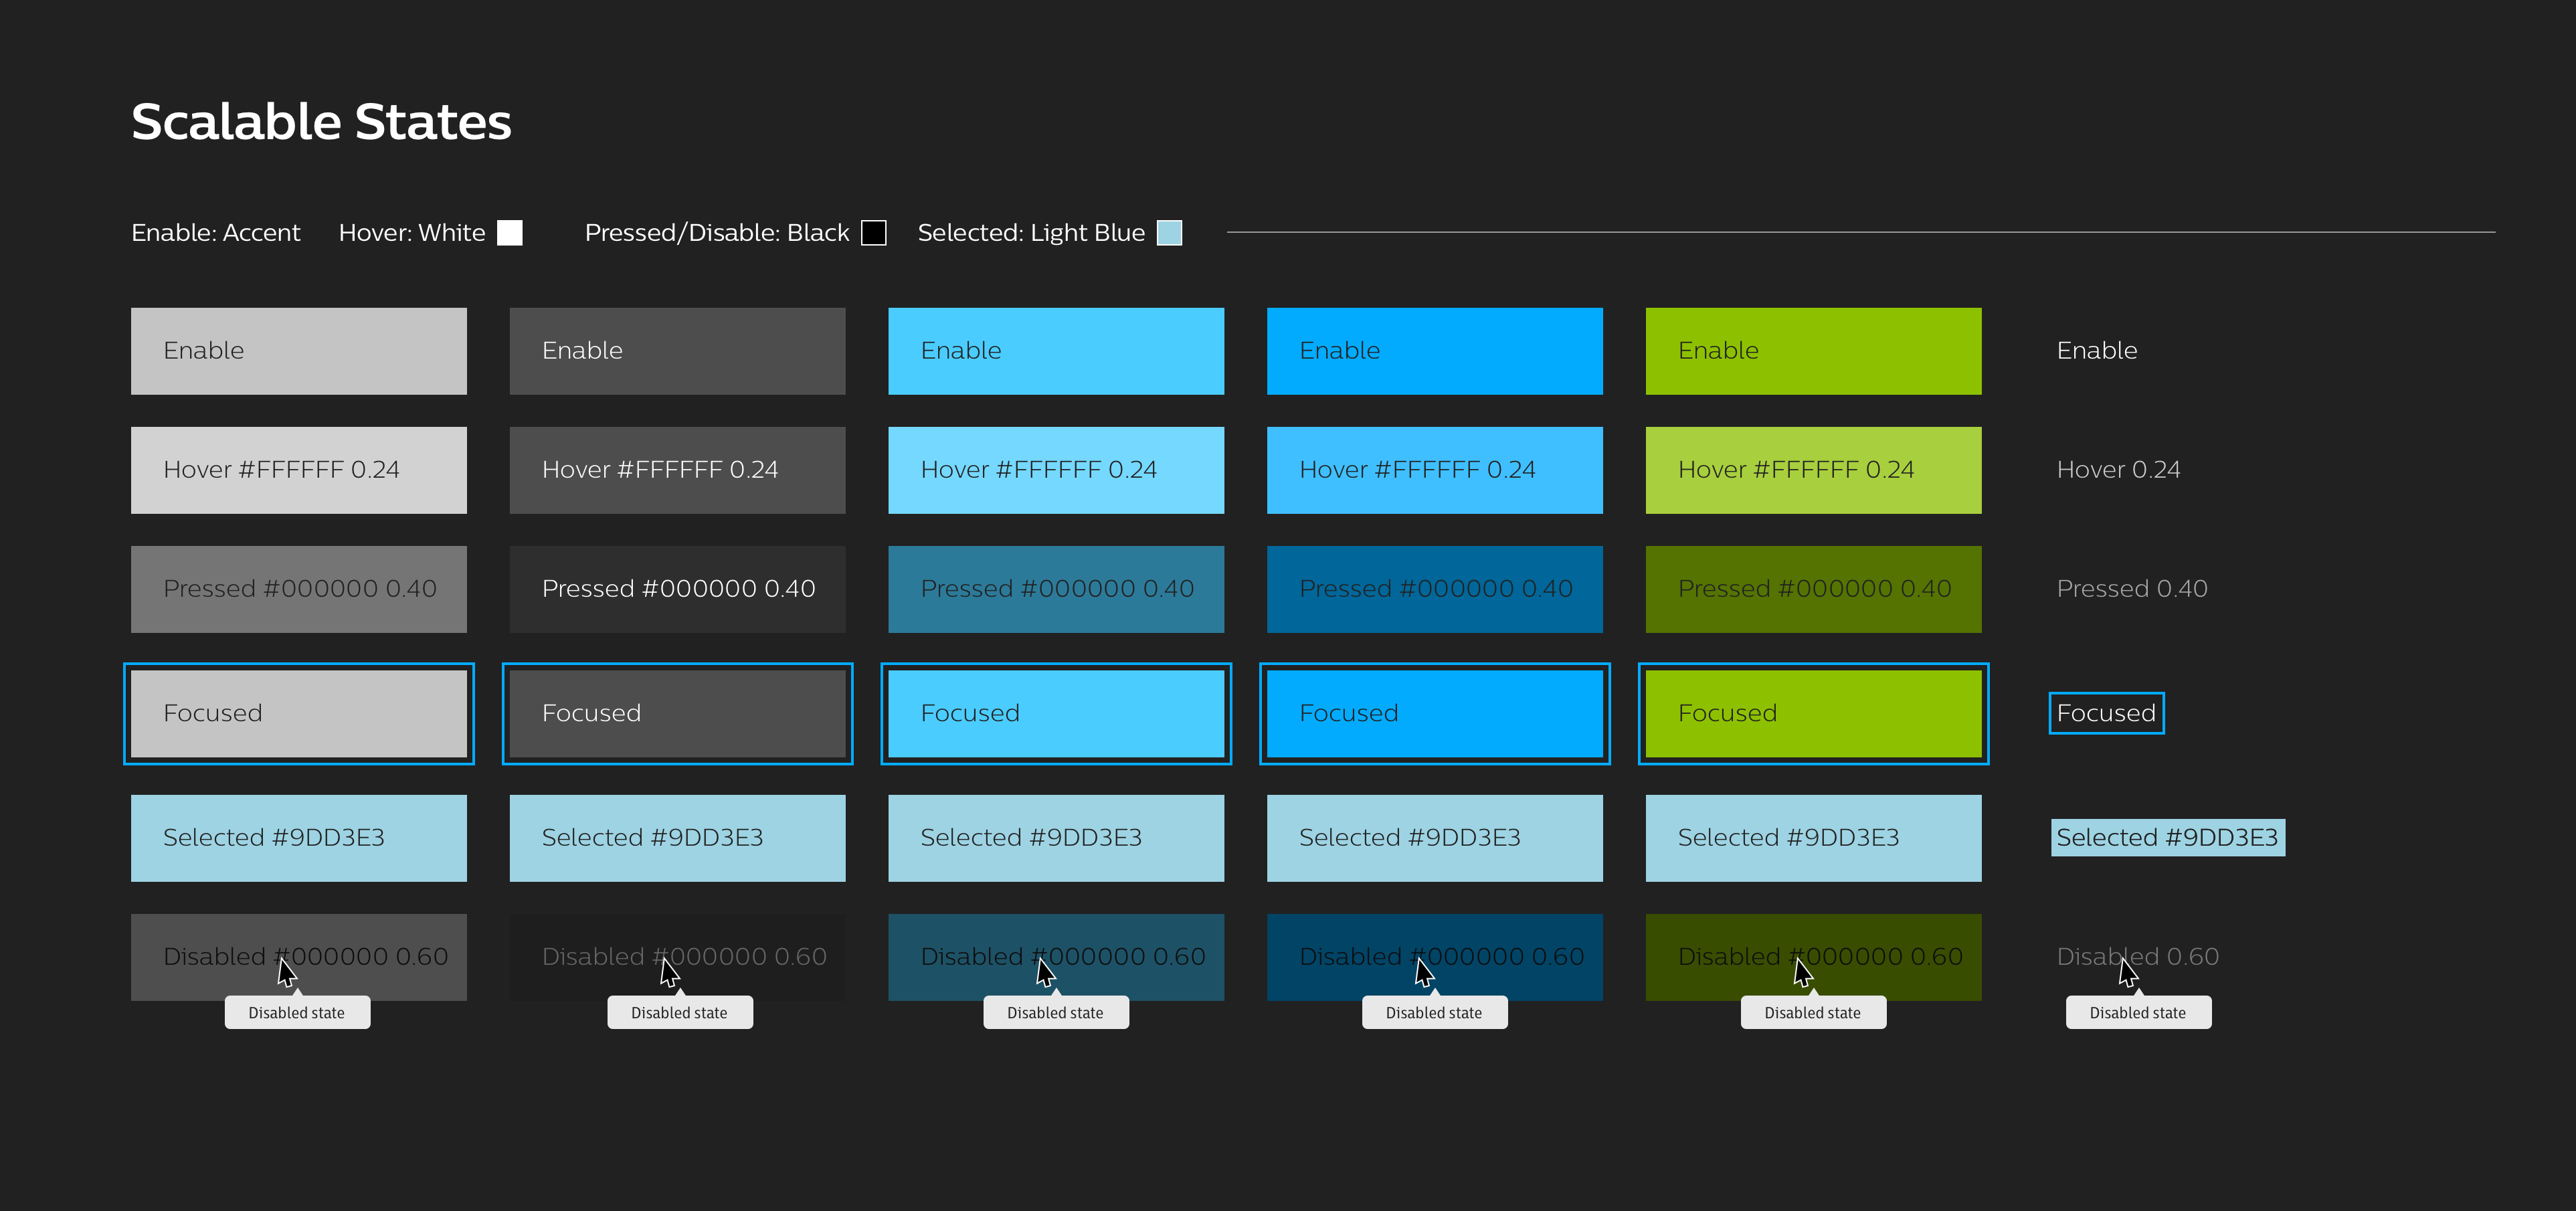
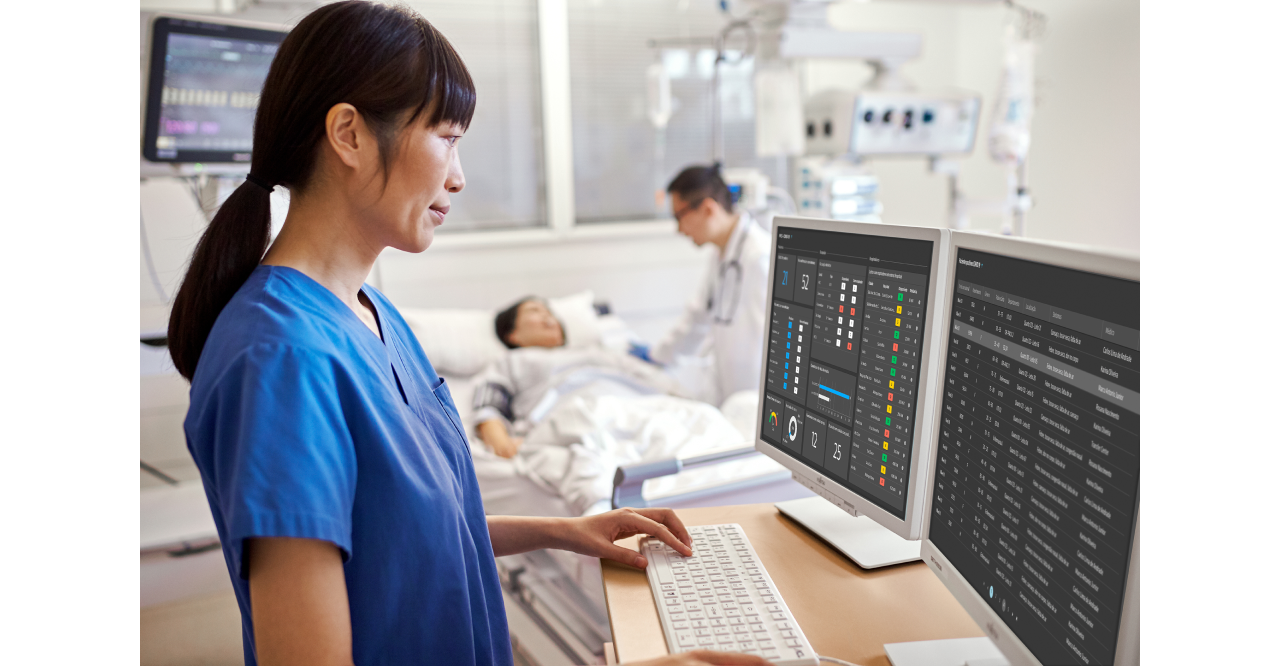
To reach the user requiments, a map of the existing components from the Design System was started in order to start ideating on the solution. We quickly translated the light theme to a dark theme aproach in order to improve readability and the use of the screnns in low-light setting environments (monitoring rooms, patient ICU rooms)

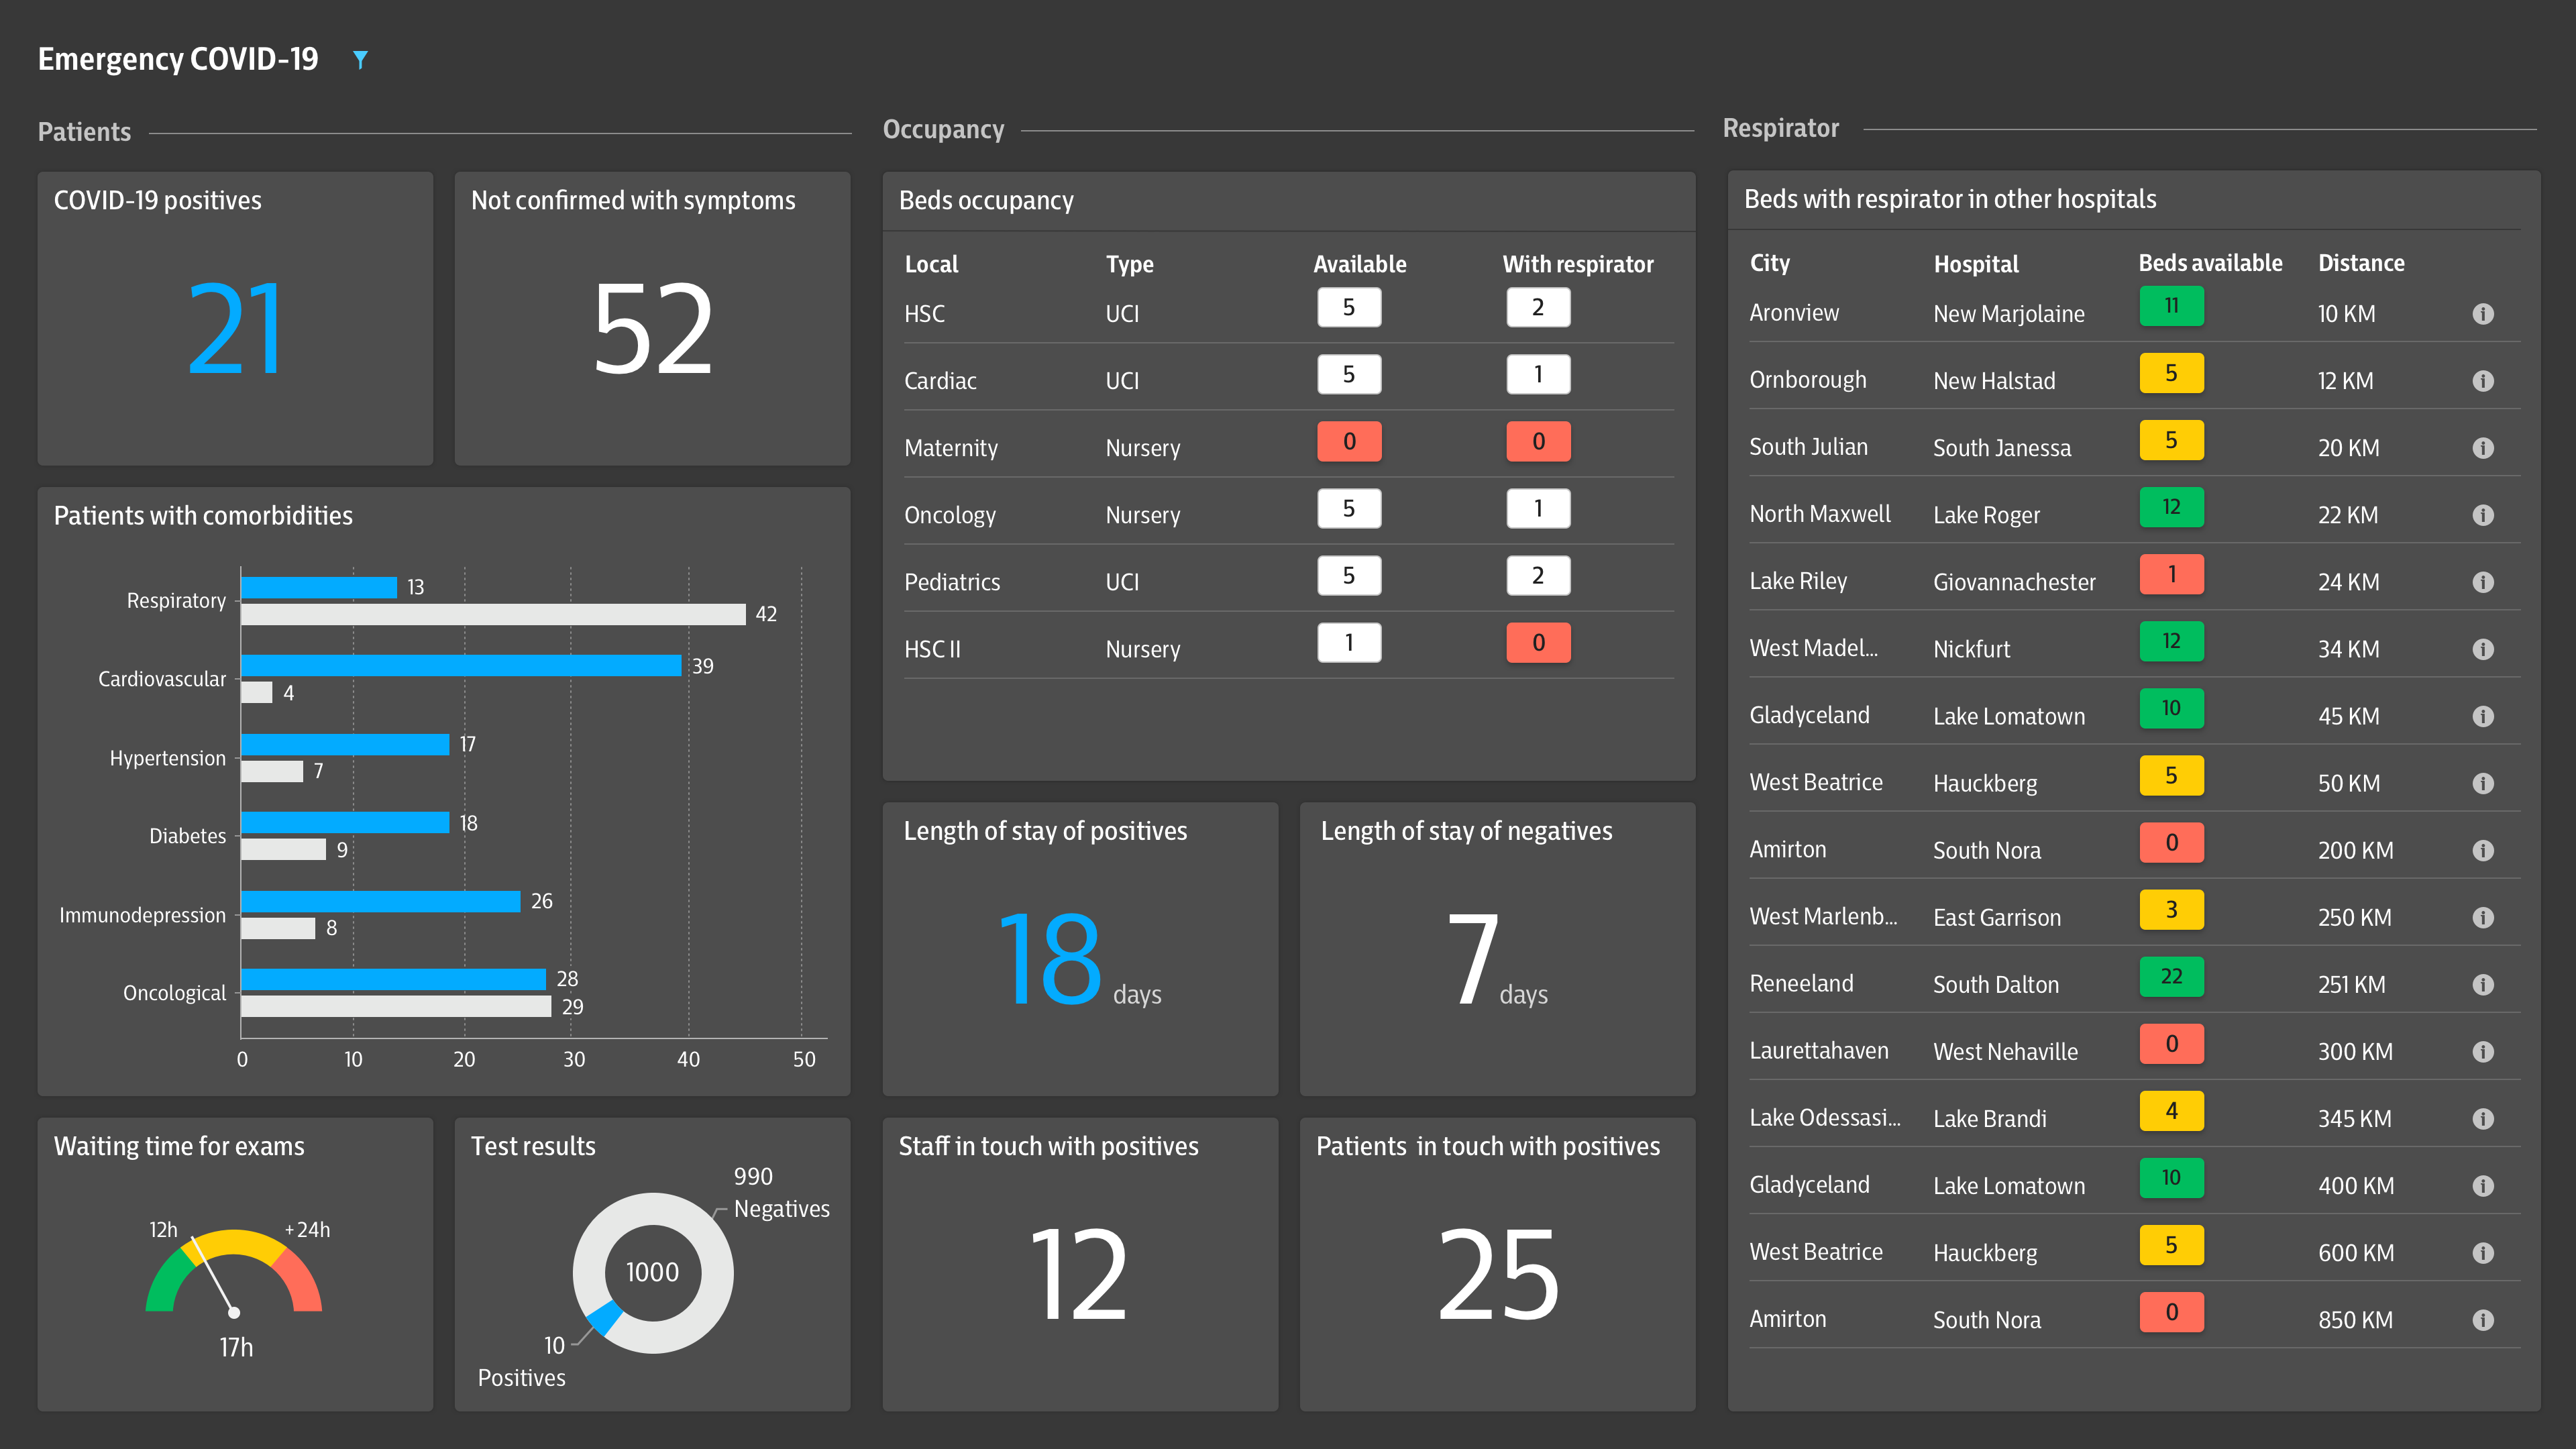
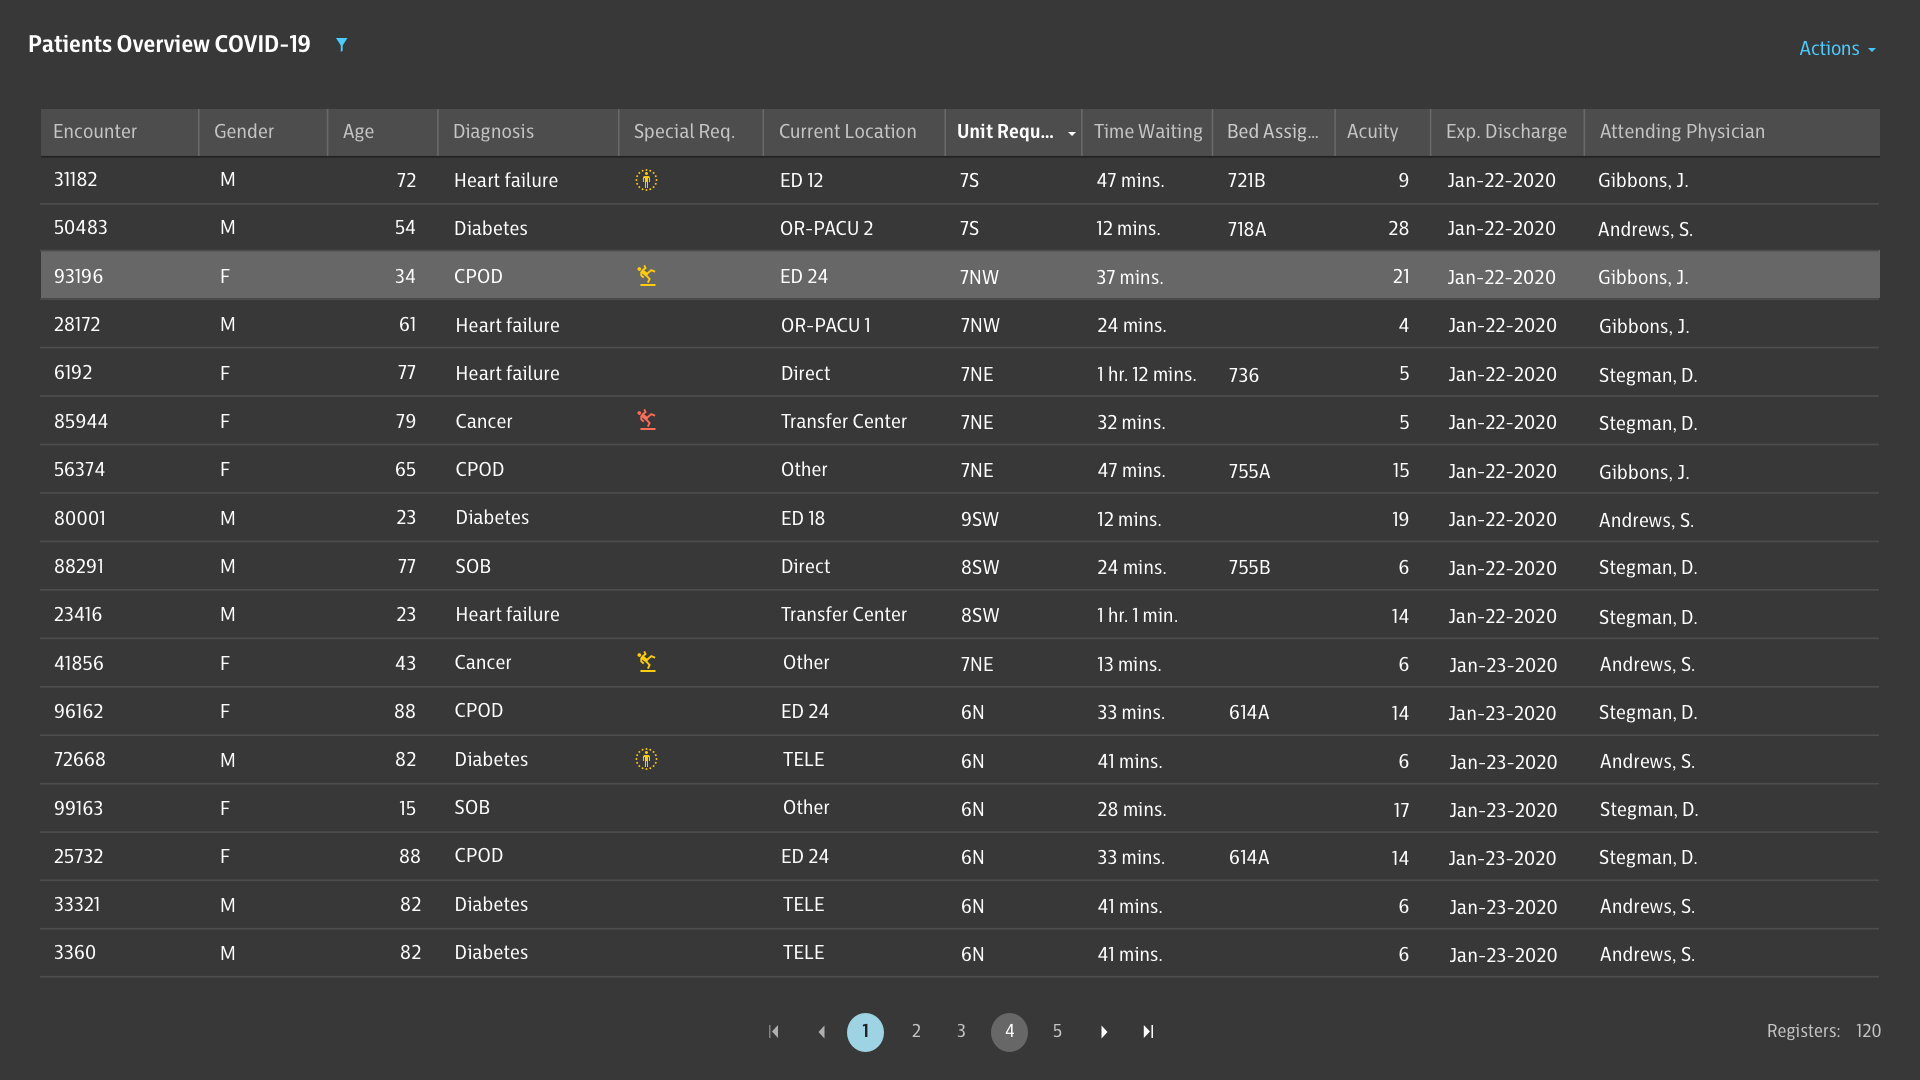
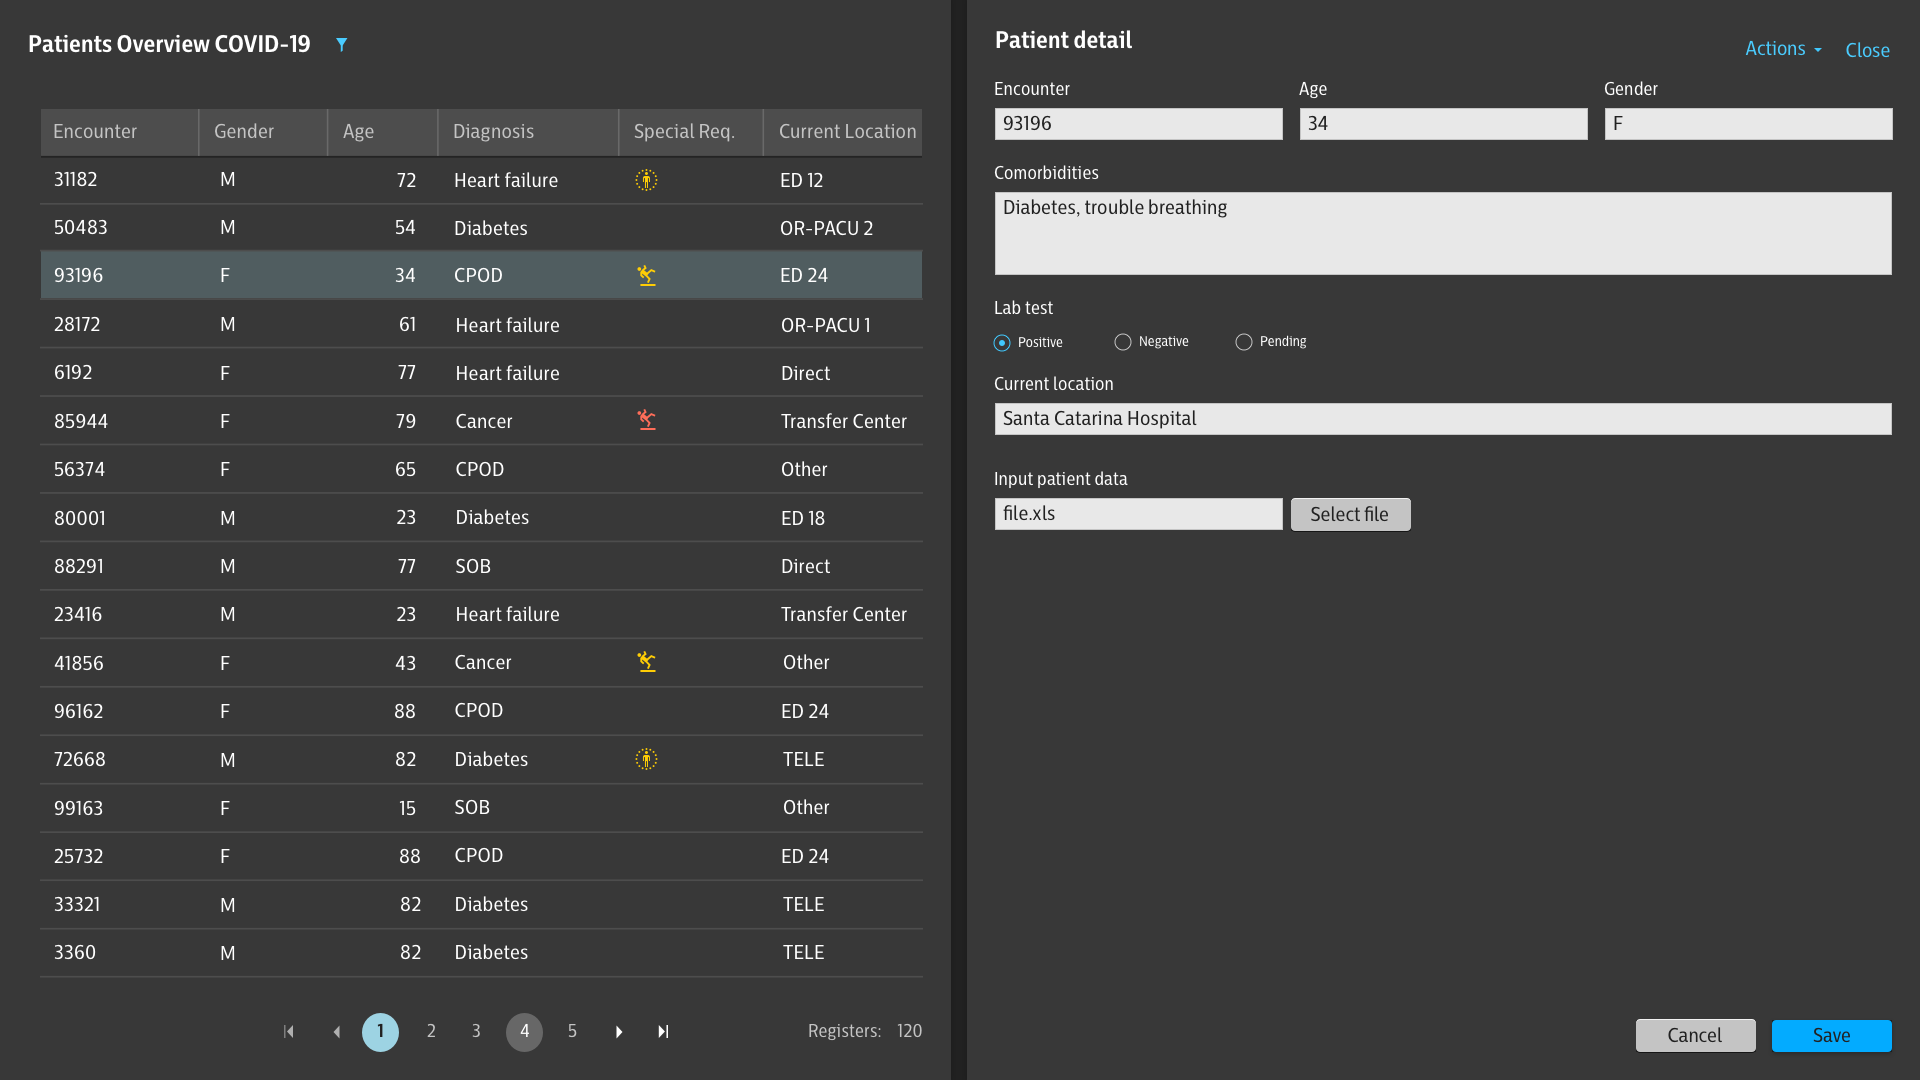
High fidelity prototypes were created to validate the solution.
The solution was validated at every step with a mixed clinical team of Philips and hospital experts to ensure it was delivering valuable and meaningful solutions.

Financial results were not the main driver for this development - finding a fast solution for customers to support them during the COVID-19 pandemic was.
Hospitals were overwhelmed with the number of respiratory patients and were globally concerned about resource availability. The quick identification and triaging of COVID-19 patients ensured that resources would be allocated for those patients most in need. No doubt there has been positive financial impact as a result of the project, but as the crisis is still ongoing, those numbers are not yet available.
The solution supports more than ten hospitals in Brazil to make collaborative operational decisions across clinical pathways. The process involved around one hundred users, such as physicians, nurses and technicians.
Customer value
• The dashboard provides hospitals an overview of patients with suspected or confirmed incidence of COVID-19.
• Beyond that, the system cross-references patients with their co-morbidities, allowing the hospitals to identify at-risk patients that are more likely to suffer severe outcomes.
• The dashboard enables hospital staff to manage resources (such as bed capacity and ventilator availability) across the system.
• User satisfaction is increased through the efficient and effective user interface designs, adapted to different environments through dark and light versions
• The combination of clinical and administrative data at the user's fingertips brings hospitals to a new resource and health management level.
Organizational culture change
• Culture chnage was effected by creating a scalable solution that connected workflows designed for multiple stakeholders and differing customer needs, while preserving the archetypes and clinical pathways.
• We raised the quality of the product through an accessible user interface, designed to accommodate the experience for users with disabilities.
Social Value
• Quickly deliver a solution to support hospitals to manage the pandemic in a way that improves their clinical outcomes and reduces mortality.
• Design a dashboard that displays patients and their co-morbidities, as well as the resources availabile, enabling optimum resource allocation.
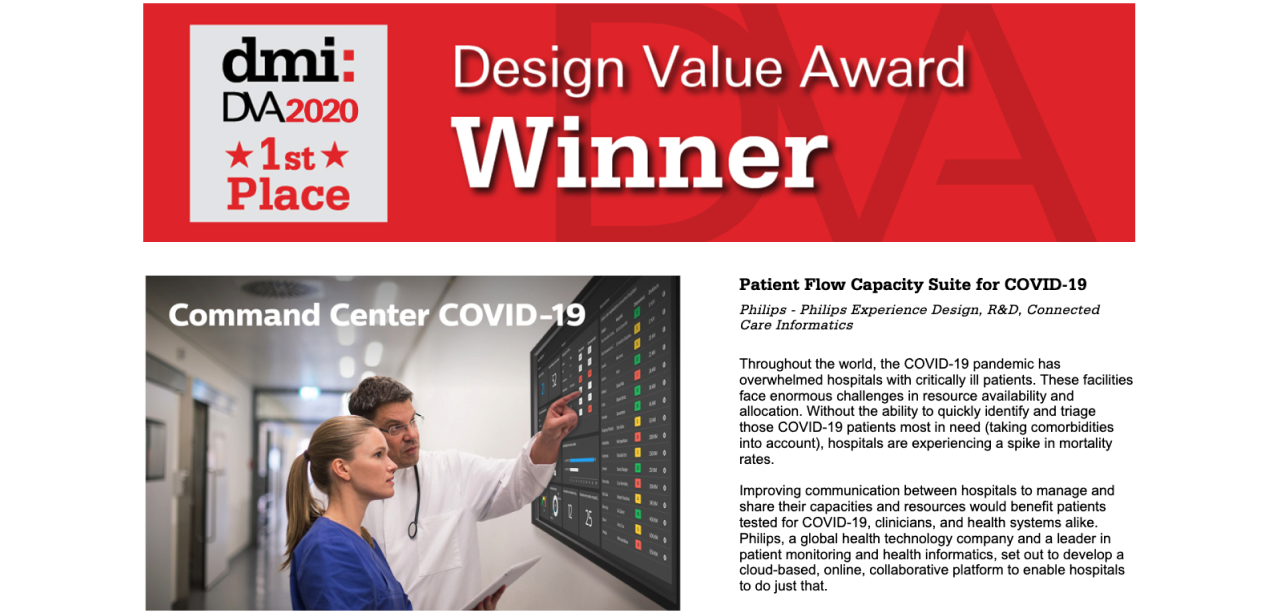
Design Value Award
In 2020, this project won the 1st Place for Design Value Award